Skip to the Main Content

Note:These pages make extensive use of the latest XHTML and CSS Standards. They ought to look great in any standards-compliant modern browser. Unfortunately, they will probably look horrible in older browsers, like Netscape 4.x and IE 4.x. Moreover, many posts use MathML, which is, currently only supported in Mozilla. My best suggestion (and you will thank me when surfing an ever-increasing number of sites on the web which have been crafted to use the new standards) is to upgrade to the latest version of your browser. If that's not possible, consider moving to the Standards-compliant and open-source Mozilla browser.

December 26, 2019

Mathematical Images

Posted by Tom Leinster

Many mathematicians like the drawings of Escher, or sculptures of surfaces, or colourful plots of fractals and other mathematical phenomena. My own taste seems to be a bit different. I’m not sure how to describe it, but over the years I’ve amassed on my computer a small collection of “mathematical” images, in some rather loose sense of the word. Every time I save one I tell myself I might use it in a blog post one day, but every time I write a blog post, I forget.

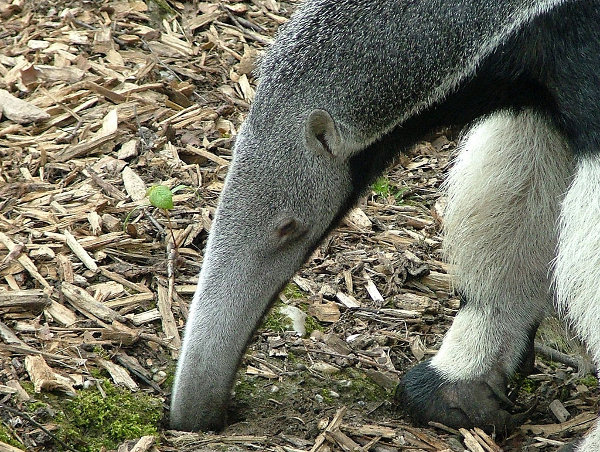
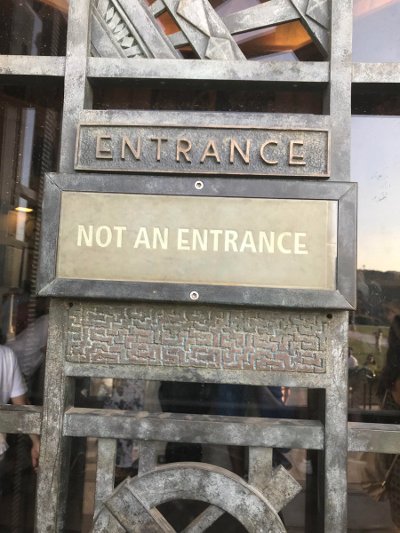
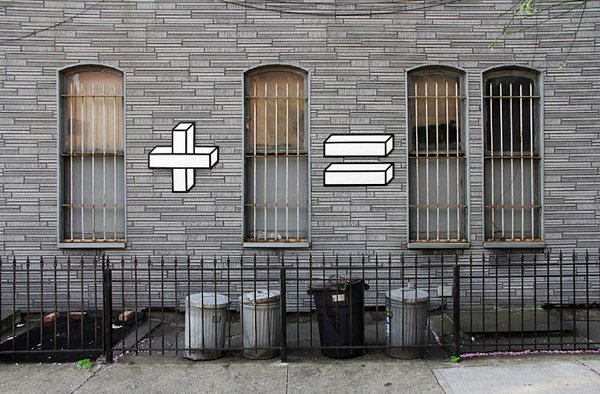
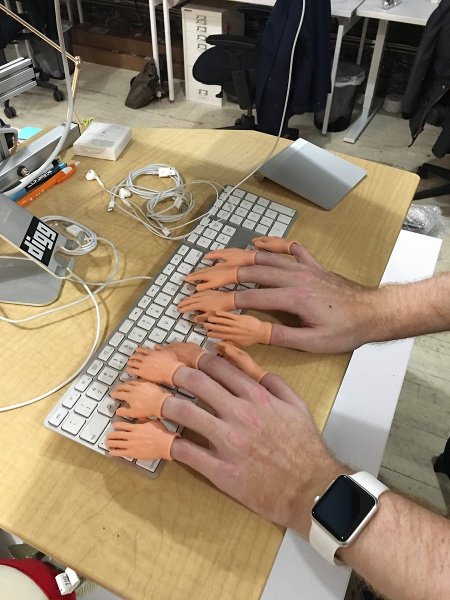
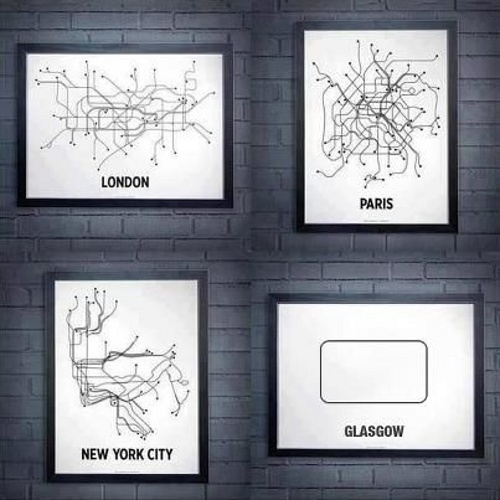
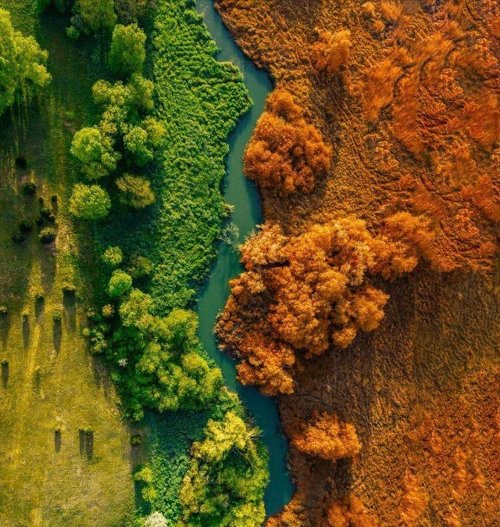
Since I never use them, and since it’s Christmas, I thought I’d present them all here instead in one big gallery. Some illustrate some mathematical concept, some refer to the experience of being a mathematician, and a couple are silly visual puns. But many just ring a bell in a part of my mind that seems to me to be connected with the activity of doing mathematics.

I’m afraid I have no idea who any of them were created by (not me!); all have been downloaded from the internet at some point. If you want to find out, I’d suggest a reverse image search.

Merry Christmas! And don’t take the images too seriously — this is just for fun.

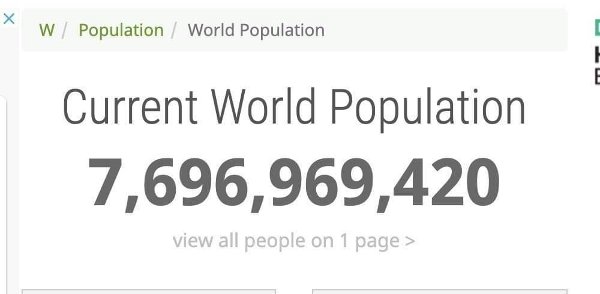
And finally, two which aren’t really images at all, but which I couldn’t resist including anyway:

Posted at December 26, 2019 11:21 PM UTC

TrackBack URL for this Entry:   https://golem.ph.utexas.edu/cgi-bin/MT-3.0/dxy-tb.fcgi/3182

4 Comments & 0 Trackbacks

Re: Mathematical Images

I don’t get all of these but the ones I do get are hilarious

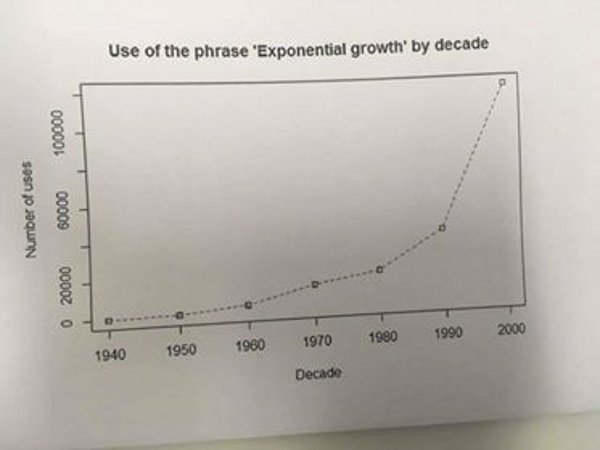
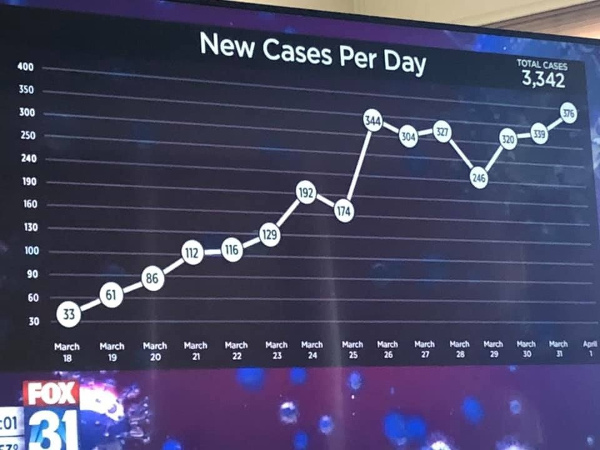
That exponential graph graph made me curious. Using Google’s NGram viewer:

From 1800 to today

From 1940 to today

Posted by: Mark on December 27, 2019 12:02 PM | Permalink | Reply to this

Re: Mathematical Images

Of course not all of these are actually meant to be funny. “Hilarious” might not have been the best choice of words there

Posted by: Mark on December 27, 2019 12:13 PM | Permalink | Reply to this

Re: Mathematical Images

Google tracks the percentage of uses though. The pictured graph has number of uses. Population graphs are of course the most insightful graphs!

Posted by: Marc on December 27, 2019 2:06 PM | Permalink | Reply to this

Re: Mathematical Images

Jamie Vicary sent me the first photo. The second was taken by some unknown sharp-eyed person.

Posted by: Tom Leinster on April 5, 2020 3:01 PM | Permalink | Reply to this

Post a New Comment