Skip to the Main Content

Note:These pages make extensive use of the latest XHTML and CSS Standards. They ought to look great in any standards-compliant modern browser. Unfortunately, they will probably look horrible in older browsers, like Netscape 4.x and IE 4.x. Moreover, many posts use MathML, which is, currently only supported in Mozilla. My best suggestion (and you will thank me when surfing an ever-increasing number of sites on the web which have been crafted to use the new standards) is to upgrade to the latest version of your browser. If that's not possible, consider moving to the Standards-compliant and open-source Mozilla browser.

January 23, 2018

FreeTikZ

Posted by Tom Leinster

guest post by Chris Heunen

I don’t have to tell you, dear nn-Category Café reader, that string diagrams are extremely useful. They speed up computations massively, reveal what makes a proof tick without an impenetrable forest of details, and suggest properties that you might not even have thought about in algebraic notation. They also make your paper friendlier to read.

However, string diagrams are also a pain to typeset. First, there is the entrance fee of learning a modern LaTeX drawing package, like TikZ. Then, there is the learning period of setting up macros tailored to string diagrams and internalizing them in your muscle memory. But even after all that investment, it still takes a lot of time. And unlike that glorious moment when you realise that you have cycled about twice the circumference of the Earth in your life, this time is mostly wasted. I estimate I’ve wasted over 2000 string diagrams’ worth of time by now.

Wouldn’t it be great if you could simply draw your diagram by hand, and have it magically converted into TikZ? Now you can!

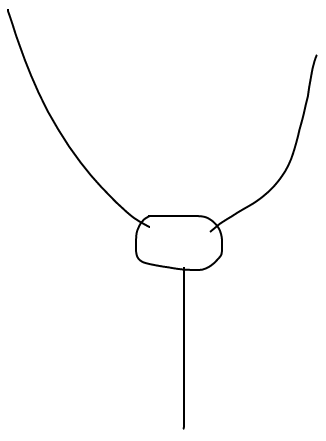
Meet FreeTikZ. It uses the magic of SVG, HTML, and Javascript, to turn

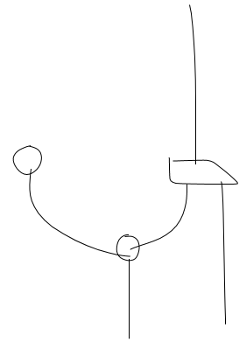
into the following LaTeX code:

\begin{tikzpicture}
  \node[dot] (d0) at (4.25, 5.5) {};
  \node[dot] (d1) at (6.25, 3.8) {};
  \node[morphism] (m0) at (7.5, 5.3) {};
  \draw (d0.center) to[out=-90, in=180] (d1.center);
  \draw (d1.center) to[out=60, in=-90] (m0.south west);
  \draw (m0.south east) to[out=-60, in=90] (8.25, 2);
  \draw (m0.north) to[out=90, in=-90] (7.5, 8.8);
  \draw (d1.center) to[out=-90, in=90] (6.25, 1.8);
\end{tikzpicture}

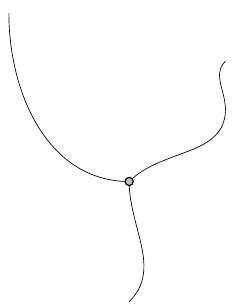
which turns into the following pdf:
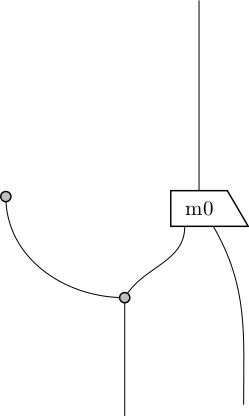
Neat, eh?

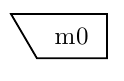
Some things to notice. To help LaTeX make sense of things like \node[dot] and \node[morphism], you will need a small latex package. This defines the shapes of the nodes. You see that FreeTikZ is geared towards morphisms that can be rotated four ways, and dots for Frobenius algebras. If you prefer different shapes, such as rectangles with a marked corner instead of morphisms, or ribbons instead of wires, or cobordism-style pictures instead of dots, this is the place to change that.

You can only draw or erase in FreeTikZ, as if you were working on paper. There is no way to move dots around once they are drawn, or to change the colour of things, or to write labels anywhere. The idea is that you use a touchscreen, or stylus, or mouse, to draw your diagram. After that, you can tweak the LaTeX code by hand, moving morphisms around, changing angles, adding labels, or whatever you like. So you still need to know a bit of TikZ, but this is much faster than typesetting your diagram from scratch. (If you really wanted, you could load the LaTeX code into TikZiT, and change the diagram with your mouse before going to your actual LaTex file and using your keyboard.)

Finally, you can download the whole source, so you can also use FreeTikZ locally. Handy for when you don’t have an internet connection, en route to your conference, desparately making slides.

How does it work?

To let this post not completely be a blatant commercial, let’s briefly explain how FreeTikZ works. Up to some webpage bookkeeping and generating LaTeX code, the heart of the algorithm solves the following problem. You’re given a list of strokes, each stroke being a list of vectors in 2\mathbb{R}^2. For each stroke, you’re asked whether it is a dot, a morphism (and if so in which orientation), or something else (that is, a wire, and if so what it connects).

How does it do that? First we compute some numerical properties of the stroke. Thinking of the stroke as spanning a polygon, we can calculate some basic properties:

From those, we can find some more advanced properties.

  • Compactness: This has nothing to do with topological compactness. Instead it measures “how close together” the points of the stroke are. For example, a circle will be very compact, but a straight line will not.
  • Eccentricity is another fundamental characteristic of polygons. It measures the shortest distance between a point and all others, and takes the maximum of that over all points.

The two most useful properties for us are the following.

  • Rectangularity is the ratio between the area of the polygon itself and the area of the smallest rectangle that contains it. So a perfect rectangle will have rectangularity 1, whereas a straight line will have rectangularity 0.
  • Circularity is the ratio between the area of the polygon itself and the area of the smallest circle that contains it. So a perfect circle will have circularity 1, whereas a straight line will have circularity 0.

We then make a simple decision. If circularity is high enough and rectangularity low enough, then our stroke is probably a dot. If rectangularity is high enough and circularity is low enough, it is probably a morphism. (In that case, we can find out its orientation by checking whether the centroid is left/right/above/below the point furthest from the centroid.) Otherwise, we leave the stroke as a wire.

Can it be improved?

This simple decision procedure is a terrible hack, but it seems to work well enough. It would be better to train a support vector machine to make the decision for us based on all these numerical characteristics. Indeed, this is what Ruiting Cao did for her MSc thesis project, on which FreeTikZ is based. Similarly, there are other areas for improvement, but the current heuristics seem to work well enough.

  • Right now dots and morphisms need to be drawn in a single stroke. If you take your stylus/finger/mouse off the screen when drawing a wire, it will end up as two wires. Segmenting and joining strokes cleverly could improve the recognition.

  • If you would like a graphical language with more shapes than just dots and morphisms, you could tweak the characteristic properties, or ideally train and use a state vector machine.

  • Wires are simplified in a somewhat buggy way. You’re given a stroke with many many points. But we would like the LaTeX code not to have hundreds of points in it. At the moment wires are simplified as follows. Annotate each point with its incoming and outgoing angles. Then throw away all points that keep the same angle, up to a certain threshold. So if your stroke has angles 90, 90, 90, 90, 89, 87, 80, 60, 45, 40, 0, you would delete all points except the ones with angles 90, 60, 45, 0 (if the threshold is 30 degrees). But, for example, especially at the start of a stroke when the user just put the pen to the screen, the angle could be off, but that is the one that will be used. There are probably better heuristics.

Luckily, all you need to know is a little JavaScript to make FreeTikZ fit all your needs! What would you like to implement?

Posted at January 23, 2018 2:01 PM UTC

TrackBack URL for this Entry:   https://golem.ph.utexas.edu/cgi-bin/MT-3.0/dxy-tb.fcgi/3009

31 Comments & 0 Trackbacks

Re: FreeTikZ

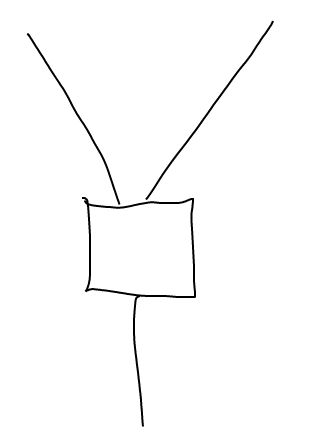
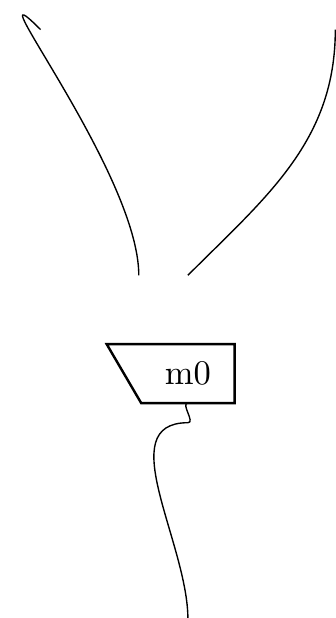
In your example, the hand-drawn input shows a very nearly straight line at the bottom-right, but in the output it’s been converted into a gentle S shape. I think the output looks good, but I’m curious as to why this happened.

It makes me even more curious that the straightish line at the top-right of the input diagram seems (to my eye) to be slightly less straight than the one at the bottom right, and yet that one remains straight in the output diagram.

My guess: it’s something to do with the attachments to the four-sided box.

Posted by: Tom Leinster on January 23, 2018 3:25 PM | Permalink | Reply to this

Re: FreeTikZ

PS: I forgot to say (as is so easy to do) — congratulations! This is an excellent idea, and automatically detecting what the user is trying to draw is impressively clever.

Posted by: Tom Leinster on January 23, 2018 11:14 PM | Permalink | Reply to this

Re: FreeTikZ

There may be two explanations. First: this may simply be to do with rounding off. The window you draw in has coordinates roughly between 0 and 500, depending on your browser window and resolution. This is converted to a TikZ picture of about 10cm by 10cm. To make things “more straight”, all coordinates (of dots, morphisms, and end-points of wires) are rounded to the nearest multiple of 5mm. Apparently in the example I drew the bottom-right line just across a 5mm boundary, whereas the top-right line stays within the same vertical grid boundaries.

Second explanation: in addition, the top end of the bottom-right wire is connected to the “south east” end of the morphism box. TikZ has predefined coordinates for this, which might not be exactly the end point of the wire I drew by hand, which is therefore moved a bit left, probably across a rounding boundary.

Finally, the “gentle S-shape” comes about because TikZ is just told the two end-points of that line, and the angles at both ends. It will then fit a nice gentle curve.

Posted by: Chris Heunen on January 24, 2018 1:14 AM | Permalink | Reply to this

Re: FreeTikZ

I tried your online FreeTikz page, and yes it does convert mouse movements to Tikz code. I was a bit disappointed that it didn’t display what that Tikz code would look like. Instead you need to paste that code into a different program.

Surely your recognition algorithm produces domain specific (string diagram) JavaScript objects corresponding to the lines of Tikz code. SVG could be generated from those.

If these JSOs were exposed (as SVG or as JSON like text) they could be online edited, allowing such things as repositioning, deletion, and label addition that would then affect the generated Tikz code. The JSON or SVG could even be useful for people who don’t want to use Tikz.

Posted by: RodMcGuire on January 23, 2018 6:32 PM | Permalink | Reply to this

Re: FreeTikZ

I had experimented with having a third part, next to the input drawing area and the latex output, namely what the compiled pdf looks like. But in the end I decided against it. There are two options to get the compiled-pdf-look, both of which are not ideal. The first option is to actually run latex. As it’s browser based you need something like texlive.js. But this is extremely slow. What’s worse, it isn’t “real latex” but just an approximation, and doesn’t seem to support packages like TikZ.

The second option is what you mention, to emulate latex/tikz yourself in svg. Drawing the svg itself is relatively easy to do. But in the end it’s again only approximating the real latex. So you still can’t be sure it looks exactly right and becomes another step in the process, and in the end you still have to run latex. As I wrote this mainly as a tool for myself to quickly generate latex code, and I’m happy to then work with the latex code and tweak it, I didn’t think this was worth it.

Nevertheless, you make a good point that this SVG or JSON might be useful for people that don’t care about latex or tikz. Moreover, if there was JSON export, then it could also be fed to other programs such as Quantomatic. I’ll look into it!

Posted by: Chris Heunen on January 24, 2018 1:26 AM | Permalink | Reply to this

Re: FreeTikZ

Chris wrote:

Moreover, if there was JSON export, then it could also be fed to other programs such as Quantomatic. I’ll look into it!

I was thinking about something like that. The great thing about string diagrams is that they aren’t just pretty pictures, they represent morphisms in symmetric monoidal categories. So, one can imagine first presenting a symmetric monoidal category by hand drawing some generators and relations (or more precisely, rewrite rules), and then drawing further string diagrams and having them automatically simplified using the rewrite rules. Or various other things like that. This would be fun.

I don’t have any serious ambitions in this direction, but I can’t resist an advertisement: in Props for network theory, Brandon Coya and I lay down the category-theoretic infrastructure needed to rigorously work with props using generators and relations, and apply this idea to a variety of examples, mainly different sorts of electrical circuits. The ‘behavior’ of networks of a given sort can be described using a morphism of props: for example, there’s a morphism of props sending any electrical circuit to the relation it imposes between potentials and currents at its input and output terminals.

All this generalizes to colored props.

A lot of what we’re doing is carefully spelling out what people do already in a less formal way.

Posted by: John Baez on January 24, 2018 4:48 PM | Permalink | Reply to this

Re: FreeTikZ

Or Globular.

Actually, it occurs to me now that Globular is also pretty good at drawing pictures. So if FreeTikZ had an output mode that included only the semantic information, i.e. what is connected to what, then it could be fed into Globular and its pictures could then be exported, even if one didn’t care about using it as a proof assistant. I don’t think Globular has a TikZ output mode, but it could probably be enhanced with one.

Posted by: Mike Shulman on January 24, 2018 7:59 PM | Permalink | Reply to this

Re: FreeTikZ

This is a really exciting idea! But I can’t get it to produce anything as nice as your example. For example, I drew this:

drew

and got this tikz code:

\begin{tikzpicture}
  \node[morphism, hvflip] (m0) at (4.5, 5) {m0};
  \draw (6, 8.5) to[out=-90, in=45] (4.5, 6);
  \draw (3, 8.5) to[out=135, in=90] (4, 6);
  \draw (m0.south) to[out=180, in=0] (4.5, 4.5) to[out=180, in=90] (4.5, 2.5);
\end{tikzpicture}

producing this output:

got

Am I doing something wrong?

Posted by: Mike Shulman on January 23, 2018 10:32 PM | Permalink | Reply to this

Re: FreeTikZ

I can reproduce the m0 thing. Here’s a simpler example. Input:

Input

Code:

\begin{tikzpicture}
  \node[morphism, hvflip] (m0) at (4, 6.5) {m0};
\end{tikzpicture}

Output:

Output

(These images are screen captures, so don’t pay any attention to the bounding boxes.)

Posted by: Tom Leinster on January 23, 2018 11:43 PM | Permalink | Reply to this

Re: FreeTikZ

Ah yes, adding the label m0 is on purpose, so that if you wanted to change it to, say, ff, you can find the right thing to change in the latex code very quickly, rather than having to hunt for the \node[morphism] based on its coordinates. The intended workflow is that you draw a diagram, freetikz-convert it to latex, edit the latex, and then compile it. In editing the latex you can just remove the labels you don’t need, and change the ones you want to change.

Posted by: Chris Heunen on January 24, 2018 1:40 AM | Permalink | Reply to this

Re: FreeTikZ

Thanks! After realizing that drawing further boxes generated labels m0, m1, m2, …, I started wondering whether that was the case. I can see that this is a good feature.

But in the example on the front page of freetikz and in the post, why isn’t there an m0? Was that Latex code produced by some earlier version of freetikz, or did you remove the m0 by hand, or what?

Posted by: Tom Leinster on January 24, 2018 1:46 AM | Permalink | Reply to this

Re: FreeTikZ

That picture was probably generated by an earlier version. I’ve updated it now. We can’t be having any false advertising, thanks!

Posted by: Chris Heunen on January 24, 2018 2:06 AM | Permalink | Reply to this

Re: FreeTikZ

Experimenting further, if I draw several isolated boxes, then the output I get is several of these quadrilaterals, containing labels m0, m1, m2, …. They’re numbered in the order in which I drew them.

Posted by: Tom Leinster on January 24, 2018 1:31 AM | Permalink | Reply to this

Re: FreeTikZ

You’re doing it wrong, only in so far that of course the program is modeled on behaviour I used while testing and writing it! So really the program is wrong, and I’ve just gotten used to how to use it. We’ve co-evolved. Joking aside, I can explain why it does this.

First, the end points of the wires are apparently not close enough to the box to connect to it. They will connect when the end-points are actually inside the polygon spanned by the box, or if they are closer than a given threshold to the centroid of this polygon. So especially if you tend to draw big, it’s better to draw wires to ‘inside’ the dot or box you want to connect them to.

Incidentally, when you draw a wire, you can see the line in the tikz code pop up, and you can see immediately if it connects like you intended. If it doesn’t, you can quickly undo (keyboard shortcut Z) and redraw the wire.

Second, the heuristic that simplifies wires can indeed be improved. For example, in the third wire in your example latex code, there is ‘a mid point too many’. Similarly, the angles on the top-left line are funny, because of the way wires are simplified. The top-left line really consists of about 100 points (depending on how quick you moved the mouse), and most of these are deleted, because you don’t want endless tikz code. But the angle of the line between the first and second point is retained, even if the 2nd to 99th point are deleted. This is probably just where you clicked the mouse button, so the mouse wobbled about a bit. I don’t really know how to make this better. Maybe take some sort of averages first? Does anybody have a good idea?

Posted by: Chris Heunen on January 24, 2018 1:38 AM | Permalink | Reply to this

Re: FreeTikZ

Thanks for the explanation! I’ve tried a number of times more, and although thanks to your hint I can now get the wires to connect to the boxes, the wires always come out squiggly all over the page no matter how carefully I draw them, with my mouse or with my stylus.

You could try doing some averaging of the angles; that might help smooth things out. I feel like the errors are also getting exaggerated a lot; perhaps you could try setting the tikz looseness parameter (or placing the bezier control points manually) depending on how close together the points end up.

Would it be possible, rather than simply deleting a bunch of the points, to try to guess what “sort of curve” the user is intending to draw and then draw that curve using only a handful of points? Most of the time when I draw a string diagram, I want my wires to have only a single bezier segment, or at most two.

Posted by: Mike Shulman on January 24, 2018 5:26 AM | Permalink | Reply to this

Re: FreeTikZ

I presume that your half-right-angled trapezoids for “morphisms” align with the conventions of some particular community, but it’s a convention I’ve never encountered, and I must admit they look very weird to me. Where do they come from?

Posted by: Mike Shulman on January 23, 2018 10:47 PM | Permalink | Reply to this

Re: FreeTikZ

The trapezoids come from the Oxford school of Categorical quantum mechanics that I was indoctrinated in. There, compact dagger categories are used often, and the idea is that the little wedge on the rectangle breaks the symmetry, so you can differentiate between the various transpositions/dagger of the box. In particular, this is the form used in a forthcoming book I’m finishing with Jamie Vicary.

Posted by: Chris Heunen on January 24, 2018 1:44 AM | Permalink | Reply to this

Re: FreeTikZ

Here’s a little problem I had: my Latex installation doesn’t recognize the document class “standalone”, which meant that when I tried FreeTikZ, the Latex didn’t compile.

Of course, I could (and did) make it work by just changing “standalone” to “article”. And I gather that “standalone” provides cropped pdf output, which was presumably why you chose it. But given that it’s not part of everyone’s Latex installation, maybe it would be useful to provide a link to standalone’s CTAN page, or say a word or two. I don’t know; it’s just a thought.

I also got slightly surprising results from my trial, though not as weird as Mike’s m0 thing. Input:

input

Output:

output

Code:

\begin{tikzpicture}
  \node[dot] (d0) at (4, 4.5) {};
  \draw (1.5, 8) to[out=-90, in=180] (d0.center);
  \draw (d0.center) to[out=45, in=-90] (6, 6) to[out=90, in=-135] (6, 7);
  \draw (d0.center) to[out=-90, in=45] (4, 2);
\end{tikzpicture}

Again, I’m surprised that a very nearly straight input line produced a curved output line.

Posted by: Tom Leinster on January 23, 2018 11:34 PM | Permalink | Reply to this

Re: FreeTikZ

I didn’t realise the standalone package isn’t part of the standard latex distribution, and thought it came with tikz. To be honest, I copied this format of making a into something compilable from texample.net. I’ll add a link to the CTAN page.

Posted by: Chris Heunen on January 24, 2018 1:48 AM | Permalink | Reply to this

Re: FreeTikZ

If you use a Debian-based Linux distribution like Ubuntu, the latex package standalone is (like many useful things) in the texlive-latex-extra package.

Posted by: Mike Shulman on January 24, 2018 5:06 AM | Permalink | Reply to this

Re: FreeTikZ

Thanks for the tip!

Posted by: Tom Leinster on January 24, 2018 4:07 PM | Permalink | Reply to this

Re: FreeTikZ

First let me say, great tool!

Is Ruiting Cao’s thesis available somewhere? I’m curious what were the primary challenges in implementing an SVM for this problem.

I’ve always had this cute idea of training some machine learning model for this kind of thing, but structuring the model to output TikZ code seemed tricky. It’d be fun to train a few layers of a model on a big set of string diagrams taken from existing papers (asking authors or a grad student to perform the much easier task of drawing already typeset diagrams by hand). These layers should be just trying to learn a diagram structure roughly at the level of detail FreeTikZ does.

Then you train another set of layers on all of the diagrams of a certain ‘class’ of diagrams one typically draws, i.e. however I like to draw a bimonoid. This would just assign ‘types’ to each string and node in the output of the other. Implementing this second stage is probably a bit silly compared to doing it by hand.

Posted by: Blake Pollard on January 24, 2018 2:44 PM | Permalink | Reply to this

Re: FreeTikZ

The MSc thesis is not public at the moment. I’ve asked her if she minds if I make it available, but she’s moved back to China and I’m not sure if she still reads the email address I have.

But the Python SVM code is available.

Posted by: Chris Heunen on January 25, 2018 12:00 PM | Permalink | Reply to this

Re: FreeTikZ

And now the thesis is here, with permission.

Posted by: Chris Heunen on January 27, 2018 4:29 PM | Permalink | Reply to this

Re: FreeTikZ

Thanks for the links!

There is growing interest in developing category theoretic software tools catering to more applied audiences. Easing the pain of drawing string diagrams is probably an important part of any such tool chain.

Posted by: Blake Pollard on March 7, 2018 9:14 PM | Permalink | Reply to this

Re: FreeTikZ

Since a while I was hoping for someone to develop a program/tool that would draw nice-looking braided diagrams in a pdf format out of diagrams written by hand, for the same reasons Chris lists in his introduction post. So, this is a great news and thanks for the initiative!

It resulted though that a simple diagram that I drew by hand ended up in a pretty different one in the pdf output (unfortunately, I didn’t find the way to paste here my screen shot or upload the file with the drawings, so to illustrate what I mean). It was the anti-algebra morphism rule, I drew circles instead of boxes for morphisms, but two out of three circles ended up in dots, and the third one ended up in a “trapeeze”. The reason for the latter could be, I guess, that where I obtained dots the starting and ending point of my circle don’t meet, while there where I got a trapeeze they do meet. The output drawing should not depend on so sensitive detail in my mouse move. Also the equality sign ended up in a line similar to the Greek letter capital Gamma.

I hope that this project evolves and saves us from so much diagram-typing! :)

Posted by: Bojana Femic on January 24, 2018 7:44 PM | Permalink | Reply to this

Re: FreeTikZ

I didn’t find the way to paste here my screen shot

The way I do this is to put the image in my web space and link to it from the comment here, using the syntax

![associated text](https://imageURL.png)
Posted by: Tom Leinster on January 24, 2018 9:00 PM | Permalink | Reply to this

Re: FreeTikZ

Thanks Tom for your tip, but I don’t know what a web space is, or should I say that I don’t have one :). I mailed my images though to Chris.

Posted by: Bojana Femic on January 25, 2018 12:08 AM | Permalink | Reply to this

Re: FreeTikZ

By “web space” I just meant your website. E.g. I might put a copy of my image at

http://www.maths.ed.ac.uk/~tl/filename.png

and you might put a copy of your image at

https://www.fing.edu.uy/~bfemic/filename.png

Anyway, it doesn’t matter now!

Posted by: Tom Leinster on January 25, 2018 2:11 AM | Permalink | Reply to this

Re: FreeTikZ

Not TikZ, but Layer 1 m 0 m_0 \begin{svg}<svg width=”170” height=”284” xmlns=”http://www.w3.org/2000/svg” xmlns:svg=”http://www.w3.org/2000/svg” xmlns:se=”http://svg-edit.googlecode.com” xmlns:math=”http://www.w3.org/1998/Math/MathML” se:nonce=”7423”> <g class=”layer”> <title>Layer 1</title> <path id=”svg_7423_10” d=”m137,112c28,20 24,124 26,172” stroke-width=”2” stroke=”#000000” fill=”none”/> <line id=”svg_7423_9” y2=”282” x2=”66” y1=”182” x1=”66” stroke-width=”2” stroke=”#000000” fill=”none”/> <path fill=”none” stroke=”#000000” stroke-width=”2” d=”m117,113c0,25 -51,44 -51,74” id=”svg_7423_8”/> <path id=”svg_7423_6” d=”m7,97c0,25 30,85 60,85” fill=”none” stroke-width=”2” stroke=”#000000”/> <circle id=”svg_7423_3” r=”5” cy=”97” cx=”7” stroke-width=”2” stroke=”#000000” fill=”#aaaaaa”/> <circle id=”svg_7423_4” r=”5” cy=”182” cx=”67” stroke-width=”2” stroke=”#000000” fill=”#aaaaaa”/> <path fill=”#FFFFFF” stroke=”#000000” stroke-width=”2” d=”m108,83l0,30l60,0l-20,-30l-40,0z” id=”svg_7423_2”/> <line id=”svg_7423_7” y2=”82” x2=”127” y1=”2” x1=”127” stroke-width=”2” stroke=”#000000” fill=”none”/> <foreignObject x=”118” y=”86” id=”svg_7423_1” font-size=”16” width=”24” height=”24”> <math xmlns=”http://www.w3.org/1998/Math/MathML” display=”inline”> <semantics> <mrow> <msub> <mi>m</mi> <mn>0</mn> </msub> </mrow> <annotation encoding=”application/x-tex”>m_0</annotation> </semantics> </math> </foreignObject> </g> </svg>\end{svg}\includegraphics[width=128pt]{notTikz} (drawn with the WYSIWYG SVG editor built into this blog) converts nicely to PDF.

It would be cool if it were possible to output TikZ code instead. What subset of SVG does FreeTikZ support?

Posted by: Jacques Distler on January 25, 2018 8:51 PM | Permalink | PGP Sig | Reply to this

P.S.

In case it wasn’t obvious, you can double-click on an equation to view its source.

Posted by: Jacques Distler on January 25, 2018 9:08 PM | Permalink | PGP Sig | Reply to this

Post a New Comment